3 - Conceptual Database Modelling and ERDs
Table of Contents
- Welcome
- Conceptual Data Modelling
- 8 Steps of Data Modelling
- Entity Relationship Diagrams
- Symbology and Formatting
- Summary
Reading Materials
- Article on Crow's Foot ERDs
- Textbook Chapter 5
- Alternative Agile Database Modelling Approach
- RESOURCE: Online ERDs:
Welcome to Week 3
This week we dive into the conceptual components of designing a database using the data modelling process and creating a UML Crow's Foot Entity Relationship Diagram (ERD). By following a detailed series of modelling steps, the student will be able to design a basic database eliminating many to many relationships and establishing relationships and their types.
Conceptual Data Modelling
Data modelling is the process of following a series of pre-defined steps to conceptually design a database schema and then developing a graphical representation of a proposed database design using entity relationship diagrams. This design will be based on the discovery of required entities, business rules, and database design requirements.
8 Steps of Data Modelling
If searching on the Internet, you will find many versions of the data modelling process steps. The following version is a simple and effective methodology that follows the principles of this course and will server you well in designing database schemas.
Step 1 - Identify Entities
Identify the major objects of which we need to store. These will likely be people, places, events about which the client needs to store data. It is easy to lose focus on this first step and start thinking attributes (or characteristics) are entities. You must be clear in determining what is an entity vs an attribute.
For Example: For a used car lot, some entities might be: Vehicles, Staff, Locations, Services offered. Be careful not to chose something like type of car as that is an attribute and not necessarily an entity. It is almost always more beneficial to start with less entities than more.
Step 2 - Identify Attributes
Identify the characteristics, or properties, of the entities that need to be stored.
Examples: Vehicle Colour, Staff First Name, Staff Last Name, Vehicle Make, Vehicle Model, etc
In addition to the attribute names, determine if the attribute is mandatory or optional data. Mandatory data are included in bold format.
Step 3 - Specify Unique Identifiers (PKs)
Define attributes within each entity that could be used as a unique identifier for individual instances of the entity. This will ultimately become the primary key, and therefore must meet the criteria for a primary key. If a suitable one could not be identified, then a new surrogate key can be added to auto-generate a key field. Primary Keys are indicated in the diagram by being underlined. They will always be bold as well as the unique identifiers will always be required.
Example: Social Insurance Number (SIN), Vehicle Identification Number (VIN), productSerialNumber, etc.
Step 4 - Define Attributes Which Form Relationships
Identify entities that have relationships with each other. At this point it does not have to be tied to a specific attribute, although it ultimately will be.
Examples:
- a sales rep may be related to customers
- products may be related to product categories
- vehicles related to manufacturers
- vehicle models associated with manufacturers
Step 5 - Define Relationship Cardinality / Optionality
Determine the number of occurrences of one entity for a single occurrence of the related entity. This typically will only have
three options - "none", "one" or "more than one". More than one is known as "many". Each relationship cardinality is defined by a range.
i.e. none or one, one or more, none or many, one and only one.
These are the possible results and are determined in BOTH directions of the relationship. (i.e. # entity 1 for each entity 2 and # entity 2 for each entity 1)
Be careful not to write these based on the existing data, but based on data that may occur in the future as well.
Lastly in this step, the Key attributes are identified as Foreign Keys that relate to their related entities Primary Key.
Examples:
- student to courses - each student can take 0 - many courses and each course will have 0 - many students in it.
- cell phone to owner - each cell phone can have 1 and only 1 owner, and each person can own 0 or many cell phones
- each car has 1 and only 1 manufacturer, but each manufacturer will make 0 or many cars.
- each professor is 1 and only 1 employee of the college, but each employee may or may not (0-1) be a professor.
Step 6 - Eliminate Many to Many Relationships
If the cardinalities for any one relationship contains a many in both directions, then it must be eliminated. This is because it is physically impossible to create a many-to-many relationship in a standard relational database.
To eliminate the many-to-many relationship, erase the relationship completely and create a new entity between the two previous entities (called a junction or bridge entity). The recreate 2 new relationships between the new entity and one each to the two original entities. In most, if not all, cases, these new relationships will be opposite 1-to-many relationships.
Examples:
- If players can play on more than one team and teams have more than one player, then this relationship is deleted and a new rosters entity will be created between players and teams. This new bridge entity will contain attributes to relate to each of the two original tables and then cardinalities between players and rosters and teams and rosters can be determined and defined.
- The relationship between students and courses will be a many-to-many, so we must create a new entity between, let's called it, classlists, that relates the classlist to students and the classlist to courses. Each of these will be 1-many relationships - or 0-1 to 0-many cardinality.
In each example above, then the new entity is created, the designer must go all the way back to step 1 from the new entity and follow the steps forward to ensure complete design and consistency.
Step 7 - Normalize the Database
The normalization process is the largest step, by far, and involves determining dependencies between attributes, and their unique identifiers. The next 3 weeks of this course covers this large topic and then you wil understand that the data modelling process via ERDs overlaps with normalization here and you need to know both in order to perfect your database designs.
The main goals for normalization is to:
- eliminate redundant data
- eliminate repeating data
- remove irrelevant associated data
- ensure full and direct dependency between all attributes and their entities unique identifier.
Step 8 - Define Attribute Types and Sizes
This final step is simply to define the attribute data types and sizes. These values are not required for any of the previous steps and therefore it is recommended to do this last to avoid having to redo them several times. Some things to note:
- chose data types to be optimal for the data type while still allowing future potential data to be inserted.
- for referential integrity, FKs and PKs
- use numeric fields over string fields wherever possible
Entity Relationship Diagrams
ERDs are a graphical representation of the proposed database showing the entities, attributes or
characteristics of
the entities, and the relationships
between the entities (people, places, concepts, and events).
There are 4 Goals for the ERDs:
- capture all the required data
- ensure no data repetition
- do not include any data that is derived from other data
- arrange the data in a logical manner
Symbology and Formatting
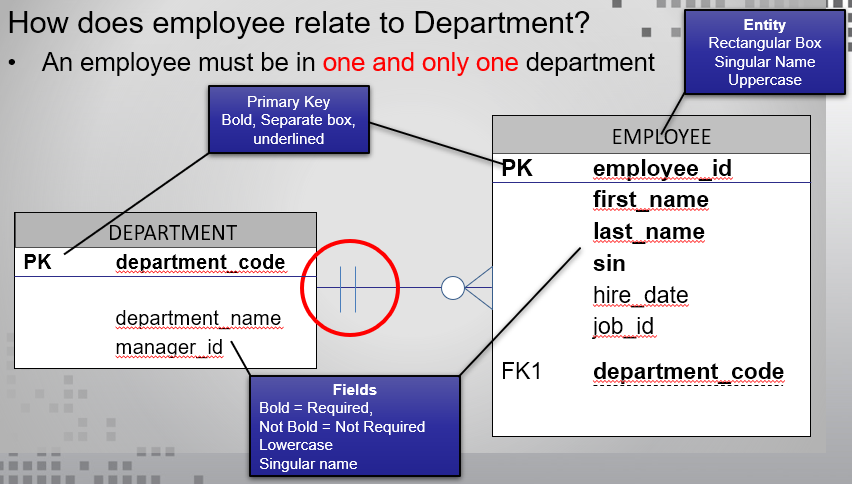
In this course, we will focus on the CROW's Foot style of UML ERD. The standards for a UML Crow's Foot ERD are:
- Entities are contained in boxes with the entity name in a top box and written in ALL CAPS
- Entity and Attribute names must be singular in nature. Singular means written as a single word, no spaces.
- Attribute names are written in one of, lower case, pascal case, or camel case.
- Unique identifiers are underlined or included in a separate section of the box.
- required fields are included using bold format.
- foreign keys are identified using FK
The cardinalities of the diagram are displayed using only 3 symbols.
- a circle - representing 0
- a line - representing 1
- a crow's foot - representing more than one. Sometimes called a fan.
EVERY relationship line will have TWO symbols on each side representing the range of values.
There are only 4
possible combinations that are used.
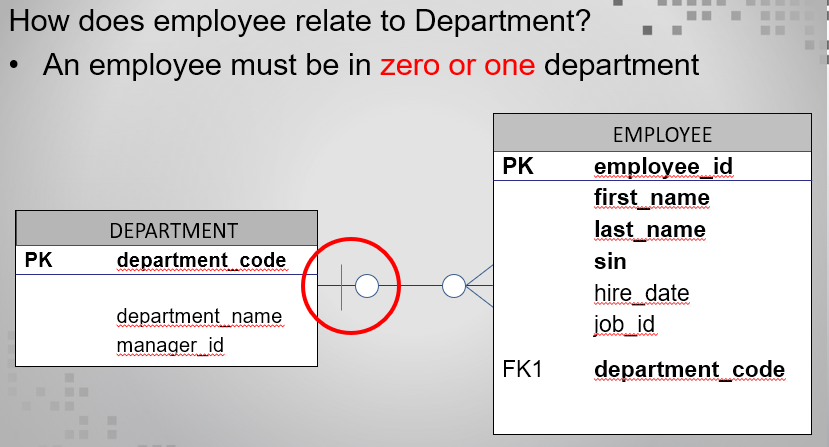
- Circle and Line - 0 to 1 entities per each related entity
- 2 lines - 1 and only 1 entity per each related entity
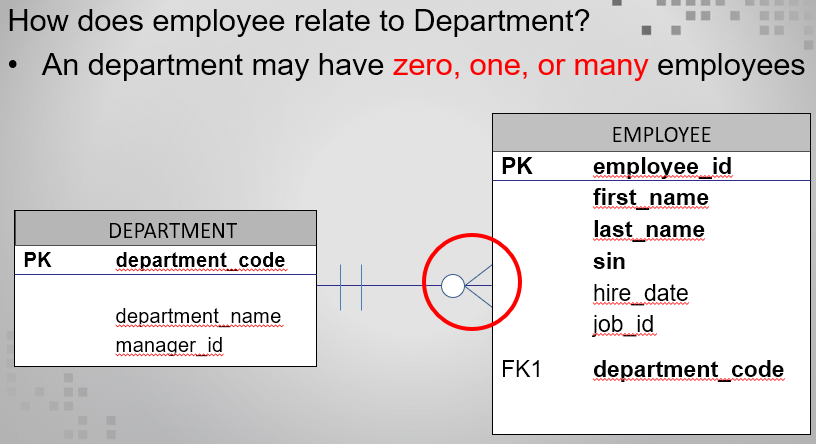
- a Circle and a Foot - 0 to Many entities per each related entity
- a line and a foot - 1 or Many entities per each related entity
In the above example:
- each department can have 0 or many employees
- each employee must be in one department and only one department
a couple more examples to learn from:
Using Diagrams.net (Draw.io) to Create a Crow's Foot ERD
The link to the referred to website is https://app.diagrams.net/
There are other online tools or you can use MicroSoft Visio to complete the ERDs. This site will demo draw.io as it is fairly simple, free and produced clean ERDs.
Creating a New ERD
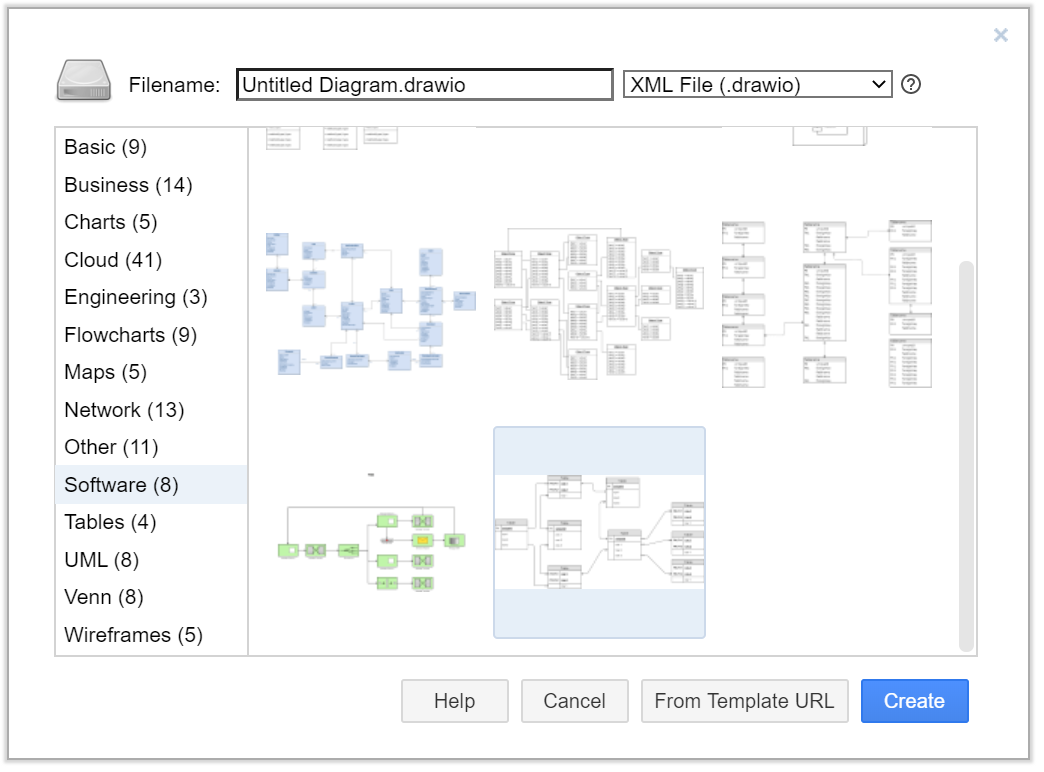
When you first visit the site, you are prompted to either create a new diagram or open a new one. Your ERDs can be saved to your local harddrive and reopened later for further editing.
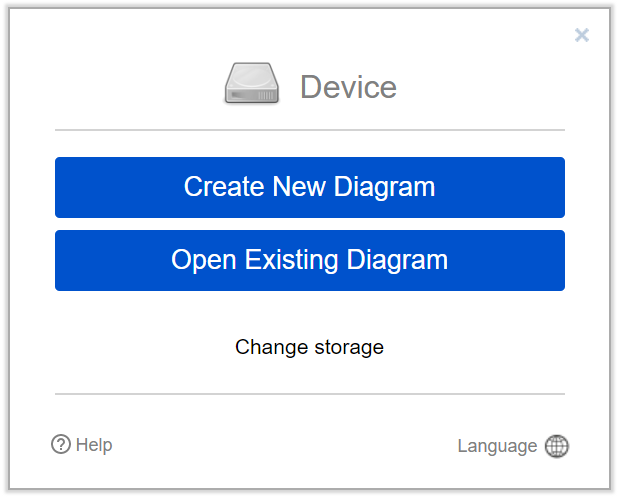
Click on Create New Diagram and then choose a crow's foot diagram.
This is the last option under the software category. Name your diagram and click Create.
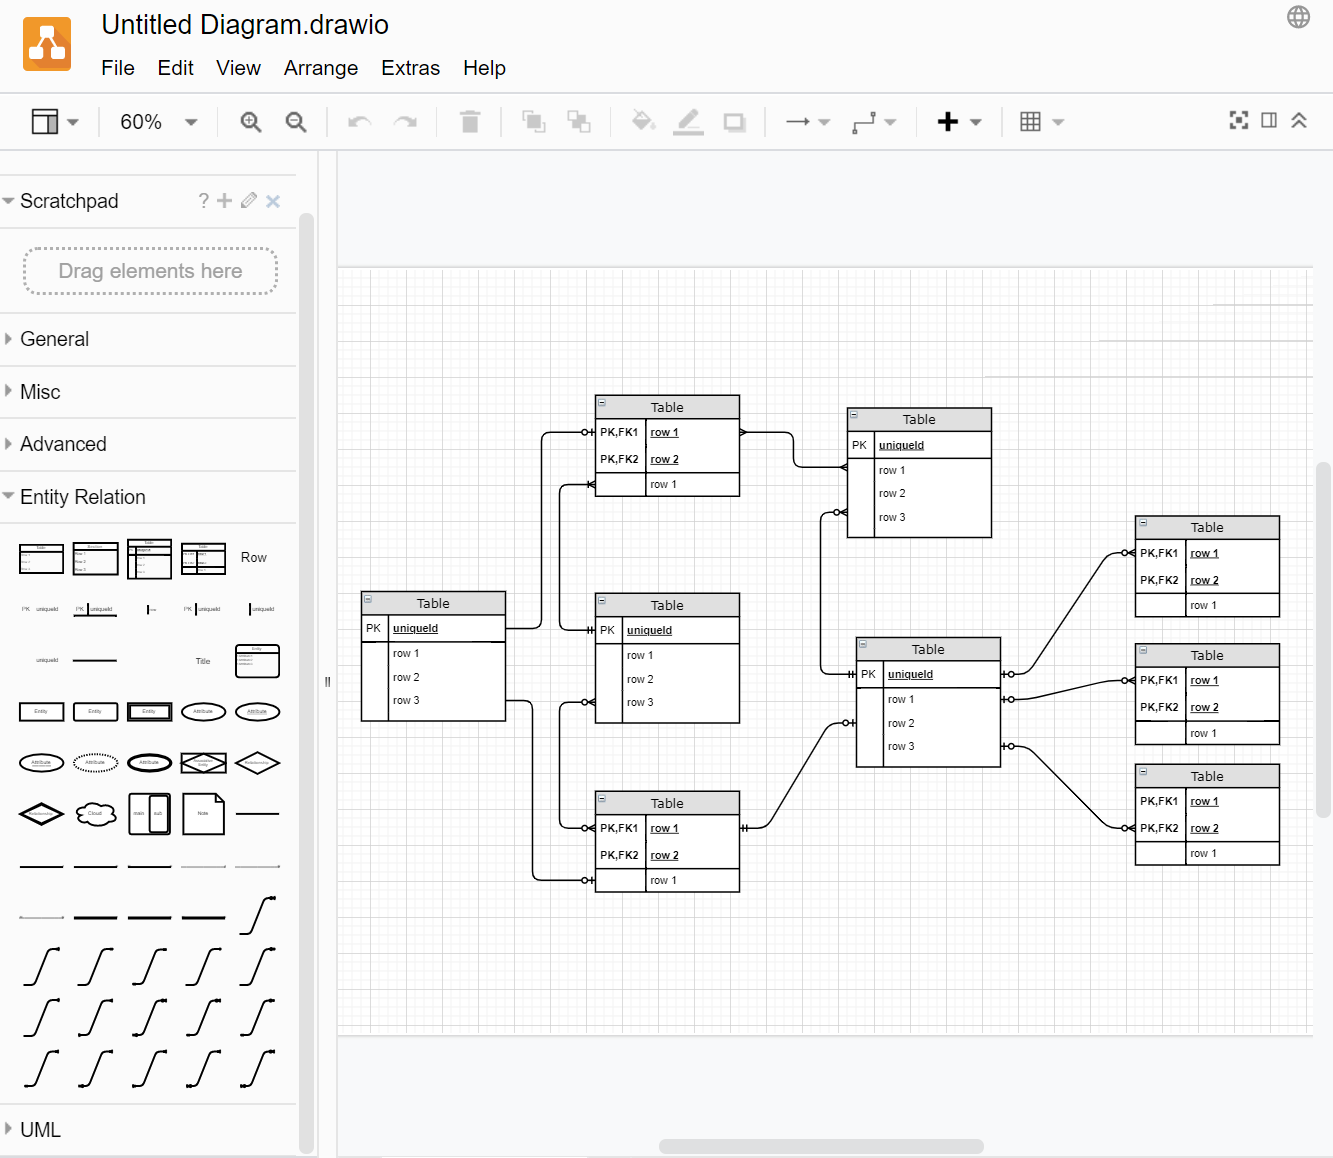
You will now have a new template diagram in front of you that you can break apart and uses the pieces to create your ERD. Make sure you expand the "Entity Relationship" object window (as shown below) to have access to additional objects you may need.
You will also want to open the format panel to edit the fonts, sizes, relationship symbols etc. Open the panel by clicking the middle icon in the top right corner.
 This panel is context sensitive, meaning it will changed depending on what object is currently selected. To edit
cardinality symbols, make sure you have a relationship selected.
This panel is context sensitive, meaning it will changed depending on what object is currently selected. To edit
cardinality symbols, make sure you have a relationship selected.
Note the difference between the entities provided in the sample diagram. There are samples of both standard single field PK entities and bridge entities with a composite key identifier.
Saving Your Work
Once you are ready to save your work, click the file menu (the one inside the browser window, not the browser file menu) and chose Save. Indicate the location you want the file saved, make sure it has a good name and click save.
The next time you need to work on the diagram, you can load the website homepage and choose open and existing diagram and navigate to the file you just saved.
IMPORTANT: The save file from this website or other websites will NOT be appropriate for submitting your work. You should first ensure your name, the date and your id is in a box on the diagram and then take a PNG screen shot or save as a PDF document for submission.